Please read Graphing Rational Functions by Hand - Overview first.
The rational functions we will be graphing will have a polynomial in the numerator and denominator and frequently the numerator and denominator will be factorable (if the degree is two or higher), or already factored for you.
To graph a rational function consider:
Click here to jump down to the examples.
Online students, see the example graph description.
A Few Graphics Calculator Tips
To find the x-intercept(s), put 0 in for y and solve for x. In this particular case, you want to make the fraction zero. That means you want to make the numerator zero. Therefore, you set the numerator equal to 0 and solve. Often this can be done visually, without writing anything down. You may get more than one x-intercept. Hint: It is often beneficial to write the x-intercept as an ordered pair, such as (3, 0). Graph the x-intercept(s). Hint: always label your axes. (back to the top)
To find the y-intercept, put 0 in for x and evaluate (find y). In this particular case, all the terms involving x drop out, so you get the constant term in the numerator over the constant term in the denominator. Often this can be done visually, without writing anything down. You will only have one y-intercept, because if you had two, it wouldn't be a function. Hint: It is often beneficial to write the y-intercept as an ordered pair, such as (0, 2/3). Graph the y-intercept. (back to the top)
Look at the denominator. Find the x-values that make the denominator zero. Vertical asymptotes are of the form x=a (where a is a number). The denominator should be factored if possible. Recall, that if the denominator has two factors, then there will be two values that make it zero (therefore, two vertical asymptotes). For example, for f(x) = (5x)/(x^2-9) = (5x)/[(x-3)(x+3)] we have vertical asymptotes at x = 3 and x = -3. Graph the vertical intercepts as dashed vertical lines. These are not part of the graph of the function, but indicate where the graph is going to have a break. (back to the top)
Once you have the vertical (dashed) lines drawn in, consider what happens near by. For example, for f(x) = (5x)/[(x-3)(x+3)], as above, let's look near x = 3. Just to the left of 3, say 2.999, two important things happen.
Therefore, to the left of x = 3, then graph will go down. That is, the y-values are getting big negative ("approaching negative infinity," if you wish).
Now we need to consider what happens just to the right of x = 3, and also what happens on either side of x = -3. This example is worked out completely in the examples below.
Indicate you your graph if the curve will be going up or down on either side of each asymptote. (back to the top)
Here we want to consider what happens when x gets very large. Note that for a polynomial, the term with the highest degree will dominate the polynomial. By this we mean it will be the primary contributor to the polynomial's value. Put differently, the other terms are "small potatoes" compared to the dominant term. For example, put x=100 into f(x) = 4x^3 + 5x^2 - 7x + 8. You get 4,049,308, which isn't much different from 4,000,000, which is what you get by just using the dominant term. Even if the polynomial was g(x) = 4x^3 -5x^2 - 7x -8, when you plug in x=100, the result is quite close to 4,000,000 (3,949,292). For a rational function, there is a dominant term on the top and dominant term on the bottom. If one has a higher degree than the other, then the rational function has one term which dominates. That means the numerator or the denominator will grow much larger, by comparison than the other side of the fraction. If the two "dominant" terms have the same degree, then neither the numerator or the denominator "takes over," but they both grow similarly. Keep reading.
What we want to do is figure out what happens on the right and left ends of the graph. There are three cases.
At this point graph the horizontal asymptote as a dashed line. Note: Horizontal asymptotes are somewhat different from their vertical counterparts. A graph can never touch (cross) a vertical asymptote. However, horizontal asymptote only help us with end behavior, that is, what happens for large positive x-values and for large negative x-values. A graph can touch (cross) a horizontal asymptote.
At this point you can probably finish the sketch of the graph. (back to the top)
If you are not sure what happens for all x-values, you may want to plug in some other x-values. One (1) is an easy number to plug in because you just have to add up the coefficients. Also, I'll often plug in a number 1 or 2 greater (or less) than an asymptote value (easy to plug into the factored form).
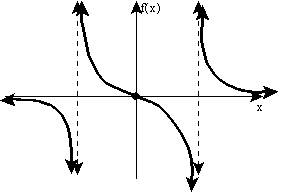
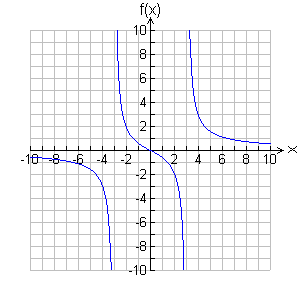
1. Graph ![]()
x-intercepts - To make the numerator 0, x must be zero. (0, 0) is the x-intercept.
y-intercepts - (0, 0) is also the y-intercept.
vertical asymptotes ("bad" x-values) - Factor the bottom into (x - 3)(x +3). Setting this equal to zero we get two vertical asymptotes: x = 3 and x = -3. So far, our graph has a point at (0, 0) and two vertical dashed lines.
near the vertical asymptotes (x-values real close and on either side of the "bad" x-values) -
horizontal asymptotes (end behavior) - The denominator has the highest degree term. Therefore, the denominator dominates (grows bigger faster than the top). Therefore, the y-values approach zero as x grows. Therefore y = 0 is the horizontal asymptote.
Other points as needed - none needed here. Now finish the graph.
| By Hand | From Technology |
 |
 |
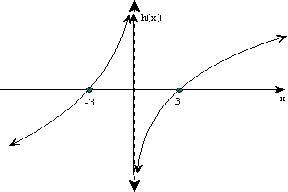
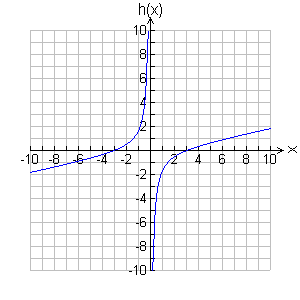
2. Graph ![]()
x-intercepts - Use the factored form, h(x) = [(x - 3)(x +3)]/5x. To make the numerator 0, x must be ±3. (3, 0) and (-3, 0) are the x-intercepts.
y-intercepts - There is no y-intercept, because y = 0 is a bad value.
Vertical asymptotes ("bad" x-values) - The line y = 0 is the vertical asymptote. So far, our graph has two points and dashed line right on top of the y-axis.
Near the vertical asymptotes (x-values real close and on either side of the "bad" x-values) -
horizontal asymptotes (end behavior) - The numerator has the highest degree term. Therefore, the numerator dominates (grows bigger faster than the bottom). Therefore, as x grows the fraction (y-values) keep growing without bound. Therefore, there is no horizontal asymptote. The graph goes up and to the right (in the first quadrant). The graph goes down and to the left (in the third quadrant).
Other points as needed - none needed here. Now finish the graph.
| By Hand | From Technology |
 |
 |
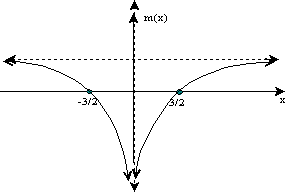
3. Graph 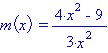
x-intercepts - Use the factored form, m(x) = [(2x - 3)(2x +3)]/(3x^2). To make the numerator 0, x must be ±3/2. (3/2, 0) and (-3/2, 0) are the x-intercepts.
y-intercepts - There is no y-intercept, because y = 0 is a bad value.
Vertical asymptotes ("bad" x-values) - The line y = 0 is the vertical asymptote. So far, our graph has two points and dashed line right on top of the y-axis.
Near the vertical asymptotes (x-values real close and on either side of the "bad" x-values) -
horizontal asymptotes (end behavior) - Neither the numerator or denominator dominate, because they have the same degree. Both top and bottom grow at the same rate. You can look at a table of values on a graphics calculator. Load the function in Y=. Use TBLSET and Start with 80 (or so) and set the change in the x-values to 10 (deltaTbl = 10). Then press TABLE. Scroll down. Notice the y-values are approaching 4/3. Therefore, the horizontal asymptote is y = 4/3. After a while you won't need the calculator, you just look at the coefficients. The graph will approach this line from the under side, for large positive x and for large negative x.
Other points as needed - none needed here. Now finish the graph.
| By Hand | From Technology |
 |
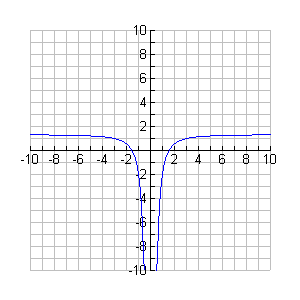 |
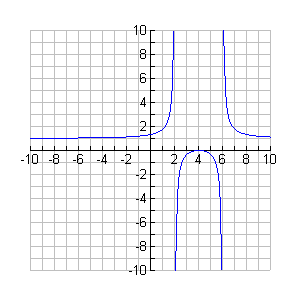
4. Graph ![]()
x-intercepts - (4, 0) is the x-intercept.
y-intercepts - Putting in 0 for y we get (-4)^2/[(-2)(-6)] = 16/12 = 4/3. The y-intercept (0, 4/3).
vertical asymptotes ("bad" x-values) - The lines y = 2 and y = 6 are the vertical asymptotes.
Near the vertical asymptotes (x-values real close and on either side of the "bad" x-values) -
horizontal asymptotes (end behavior) - Neither the numerator or denominator dominate, because they have the same degree. Therefore, the horizontal asymptote is y = 1 (from 1/1).
Other points as needed - none needed here. Now finish the graph.
| By Hand | From Technology |
 |
 |
Here are a few extra neat things to know that can help make the graph. These are "not required," because you can get along without them, but I find them useful at times.
Disclaimer: This does not claim to state everything there is to know about graphing rational functions, but these easy concepts, one can get pretty accurate graphs for many rational functions.
Updated: April 8, 2004