Steps for using the TI-83
or 84 for finding models for data
(Regression Models)
Enter Data (1)
> press STAT, then ENTER (in
order to edit) and type ordered pairs in L1 and L2
(hint: to quickly clear an old
list, go to the top
and press CLEAR)
To look at a scatterplot
 >
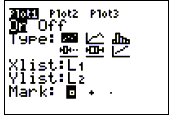
press 2nd STAT PLOT and make sure that a plot (probably Plot1)
is set properly for a scatterplot (On, scatterplot, x-list L1, y-list L2 as
shown at the right) Plot2 and Plot3 should be OFF.
> press ZOOM, 9:ZoomStat (which
also sends you to GRAPH)
(> press GRAPH anytime to go
to the graph)
To find the model (equation)
> press STAT, CALC
> press LinReg, QuadReg, or
ExpReg... (for linear,
quadratic, and exponential regression, respectively)
> press ENTER (assuming you
used L1 and L2) (if you
wish to use other lists, they must be specified))
Load the equation into the calculator for future use
> press Y=
(> CLEAR out the old equations--if
you didn't do this initially)
> press VARS (for
variables), Statistics,
EQ, RegEQ (for regression
equation)
To see your model graphed on top of the scatterplot
> press GRAPH
(2)
To plug in an x-value into your model
> Press TRACE (press the up-arrow
to trace on Y1) and type in the x-value and press ENTER (you may have to adjust
the WINDOW to make the point visible).
> There are three (3) other
ways to do this, including (a) TABLE; (b) 2nd|CALC|Value; (c) 2nd
QUIT (to return to the home screen, if needed) |VARS (for
variables), Y-Vars, Function,
Y1 (or whichever function
you loaded it into), "(#)"
where # is a number, ENTER
Footnotes
1. Before entering data, it is good practice to press
Y= and CLEAR all existing equations.
2. TRACE works nicely at this point. steps x
right and left. switches from the data to the model and back.
Jim Olsen, Western
Illinois University
 >
press 2nd STAT PLOT and make sure that a plot (probably Plot1)
is set properly for a scatterplot (On, scatterplot, x-list L1, y-list L2 as
shown at the right) Plot2 and Plot3 should be OFF.