Title: Push Pins
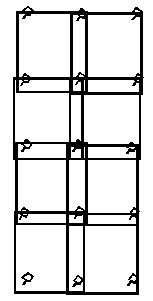
Problem: The art teacher uses 4 push pins, one in each corner, to hang a drawing on a bulletin board. If she overlaps the corners, she can hang 2 drawings with only 6 push pins. What is the minimum number of push pins the art teacher needs to hang 8 drawings?
Math Topic/Concept: number sense, 2-dimensional visualization, addition, patterning
Materials: paper and pencil
Classroom Use: (Introductory)
Grade: 5
Grade Cluster: (LateElem)
Illinois Goal: 6, 9
Standard: 6A2, 9B2
Applied? (1-4): 3
Source: Middle Grades Math Tools for Success , Prentice Hall (ISBN # 0-13-427709-0)
Answer: 15 push pins
Strategies Listed: Draw a picture
Solution: Make a drawing that would look like this:
Extensions or related problems*: Change the number of pieces of paper
Intended rubric or assessment method: Informal assessment
Write-up submitted by: Jonna Young
Problem: Propose this task: Each of you will construct geometric figures (polygons) based on specific descriptions and within the stated restrictions on the data card you receive. (On the data cards, provide restrictions for the characteristics of the polygon; for example, I have 2 sets of parallel sides, all of my corners form right angles, and I might have two lines of symmetry but not 3 or 4.)
1. Consider what polygon you might have, then write down your guess
and explain what information on the card helped you make that guess.
2. Using the appropriate tools, construct the figure precisely and
neatly. Label your dimensions (in. or cm.), and name each of the
sides (A, B, C, etc.)
Math Topic/Concept: identifying and constructing polygons
Materials: paper & pencil, rules, protractors (optional: grid paper)
Classroom Use: (Evaluation)
Classroom use comments*: Prior to this activity, review the basic shapes of polygons and discuss their characteristics. Provide data cards (a different one for each student).
Grade: 4
Grade Cluster: (LateElem)
Illinois Goal: 9
Standard: 9.B.2 and 9.C.2
Applied? (1-4): 2 (possibly 3 if extension problem is used)
Source: various worksheets, ideas, and suggestions from textbooks and conferences
Answer: various, according to data cards created by teacher and according to dimensions selected by students. Check student products for accuracy.
Strategies Listed: prediction, logical thinking, measurement, application of information
Solution: Students will analyze the information on the data cards and consider the basic characteristics of specific geometric figures. They will record their guesses and then use appropriate tools to draw accurate figures on paper. During and after the construction, students will check the data card to match their figures to all descriptions and restrictions listed on the card.
Other solution methods (if any)*: computer-generated drawings
Extensions or related problems*: Use flip, slide, and turn with favorite polygon to create a pattern. Explain (in writing) how the characteristics of the chosen polygon affect the outcome of the pattern (e.g. circular, linear, overlapping, lines of symmetry, extended, etc.)
Intended rubric or assessment method: Analytical Scoring Scale (Jim Olsen, WIU)
Write-up submitted by: Rebecca Cummins (Westmer CUSD 203)
Problem: This week we're going to do an experiment. I'd like to collect some data about circles, and I'm hoping you'll help me. I want to see what we can discover about the relation between parts of circles. To do this, we're going to collect data by measuring around some circular objects and measuring across them at their widest parts. When measuring around the circle we will be finding the circumference. We will be measuring across the circle to find the length of the diameter. I'm going to start our experiment with two circular objects from my house, which I've placed in the chart below.
# Description Circumference (C) Diameter (d) Ratio (C/d)
1 pencil eraser 21 millimeters 7 millimeters 3 millimeters
2 pumpkin pie plate 30.5 inches 9.5 inches 3.21 inches
You need to complete three steps for this week's problem:
1.Add ten more items to the chart started above.
2.Complete the calculations necessary to fill in the last column of the
chart.
3.Find the mean of the twelve ratios in the last column of the chart.
For your final answer, use a complete sentence to write your conclusion based on the work outlined above.
Math Topic/Concept: Property of Circles, Ratio, and Mean, pi.
Materials: Rulers, Measuring Tapes, Objects to Measure, Worksheet with Chart
Classroom Use: (Introductory)
Classroom use comments*: Could assign to work together in groups
of 2-4 students
The chart that is being referred to is on the web site under source.
All you have to do is scroll down through the problem and you will see
the link Circles Around Worksheet. Click on the link and make copy
by printing the screen.
Grade: 4/5
Grade Cluster: (LateElem)
Illinois Goal: 9
Standard: 9B2, 9C2
Applied? (1-4): 2
Source: http://forum.swarthmore.edu/elempow/print_puzzler.ehtml?puzzle
Answer: Dependent on the objects selected to be measured
Strategies Listed: Measurement, Division, Predicting, Number Patterns
Solution: To solve the chart a person needs to find the measurement of ten more objects circumference and diameter. Record the information gathered on a chart. Once the chart is complete, you need to find the ratio of each item, which is done by dividing the circumference by the diameter. For example, the pencil eraser is 21mm in circumference and 7 mm in diameter (21 ÷ 7 = 3). And the final step is to take the 12 ratios and add all of their sums and divide it by 12 to find the mean or average ratio of each object. The mean should ended up closely resembling the rounded value of pi, which is 3.14.
Intended rubric or assessment method:
Assessment ISAT Mathematics Grade 5 Student-Friendly Rubric
www.isbe.state.il.us/isat/rubric5.htm
Write-up submitted by: Carl Carlson Westmer School
James R. Olsen, Western Illinois University
E-mail: jr-olsen@wiu.edu
updated June 27, 2001