Problem: Mrs. Spears was putting six new bears in the display
case at the toy store. The
case had
three shelves, one on top of the other, with two spaces on each shelf.
Each bear had a name: Donald, Marcum,
Annie, Dana, Jason, and Melissa.
+ Mrs. Spears put Dana next to Jason and above Melissa.
+ She did not put Marcum next to Jason or Melissa.
+ She did not put Donald next to Marcum.
Where did Mrs. Spears put these bears?
Math Topic/Concept: Logical reasoning
Materials: Markers to represent bears
Classroom Use: (Developmental)
Grade: 4th Grade
Grade Cluster: (LateElem)
Illinois Goal: 10
Standard: 10.A.2a
Applied? (1-4): 2
Source: The Problem Solver 4 by Judy Goodnow and Shirley
Hoogeboom Creative
Publications ISBN 0-88488-584- 4
Answer: There is more than one way to arrange the bears using the same directions.
Strategies Listed: Act it out or use objects to represent the bears
Solution: One solution Arrangement of Bears
Annie Marcum
Jason Dana
Donald Melissa
Intended rubric or assessment method: Teacher observation
Write-up submitted by: Donna Spears
Problem: The Student Council members took a survey of the
635 students at Bright Middle School to find out what their favorite school
lunches were. The Council wanted to use the information in a report
for the school newsletter. Only 593 survey forms were returned.
Here were the results:
|
|
|
|
|
|
|
|
|
|
|
|
|
|
|
|
|
|
|
|
|
|
|
|
|
|
|
|
|
|
|
|
|
|
|
Math Topic/Concept: number sense
Materials: paper, pencil, graph paper
Classroom Use: (Developmental)
Grade: 5
Grade Cluster: (LateElem)
Illinois Goal: 10.A.2a
Standard: 10.A.2a
Applied? (1-4): 3
Source: Explain It! Creative Publications Grades 5-6 ISBN 0-7622-1598-4
Answer: Students should use a pictograph or bar graph to show this data.
Strategies Listed: Students create graphs that will explain their data clearly.
Solution:
Other solution methods (if any)*: A pictograph could also be used. You could use a symbol such as a smiley face to show 50 students. Each line would show the total number of students that picked each kind of lunch.
Intended rubric or assessment method: Grade 5 "Student Friendly" Mathematics Scoring Rubric found at http://www.isbe.il.us/isat/rubric5.htm
Write-up submitted by: Ann Hulsizer, 5th Grade, Monmouth
Problem: Take a bag of M&M's and figure out the fraction and percent of each color. Use the information to create a circle graph representing the percent of each color. Explain your results.
Math Topic/Concept: Collect and Organize Data
Materials: Bags of M&M's for students
Classroom Use: (Developmental)
Grade: 4/5
Grade Cluster: (LateElem)
Illinois Goal: 10
Standard: 10A2d, 10B2b, 10B2d
Applied? (1-4): 3
Source: www.isbe.state.il.us/ils/benchmarking/mathactivities.htm#LE
Answer: Varies according to the colors represented in each bag. I performed the task as I wrote the problem. Blue 30%, Yellow 30%, Brown 20%, Orange 10%, Green 5%, and Red 5%
Strategies Listed: Fractions, Percents, Graphing, Organizing Data
Solution: I included a delicious example for purposes of filling this space with some information. I took a bag of peanut M&M=s and opened them to count how many total pieces there were and organized them into groups based on colors. There was 6 blue, 6 yellow, 4 brown, 2 orange, 1 green, and 1 red. I created fractions for each color, for example, 6/20 blue, 6/20 yellow, 4/20 brown, etc. I reduced my fractions to lowest terms and converted them into percents and took that information and placed it accordingly into the circle graph.
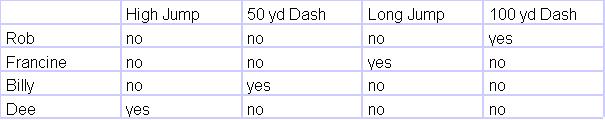
Problem: Rob, Francine, Billy, and Dee are in a track meet. Each person is in one event. The events are the high jump, 50-yard dash, long jump, and the 100-yard dash. Dees event requires a metal bar. Neither Billy nor Rob is in the long jump. Billy lives next door to the person who is doing the 100-yard dash. Who is running the 100-yard dash?
Math Topic/Concept: Logical Reasoning and Working Backwards
Materials: NA
Classroom Use: (Developmental)
Classroom use comments*: NA
Grade: 5
Grade Cluster: (LateElem)
Illinois Goal: 10
Standard: 10A2a
Applied? (1-4): 2
Source: Exploring Mathematics Practice Scott, Foresman and Company Grade 5 1995
Answer: Rob is running the 100-yard dash.
Strategies Listed: Reasoning, Charting Information, Order of Events
Solution: Through a process of elimination, you can see that Dee does the high jump because her event is the only one that requires a metal bar. Billy is not in the long jump or the 100-yard dash, so that leaves only the 50-yard dash as his event. With only two people left for two events, I narrowed the answer down to Rob being in the 100-yard dash because it already said he wasnt in the long jump. So the answer is Rob ran in the 100-yard dash.
Other solution methods (if any)*: It might be quicker to solve if a person worked the problem backwards.
Intended rubric or assessment method: Analytic Scoring Scale (Jim Olsen-W.I.U.)
Write-up submitted by: Carl Carlson Westmer School
Problem: Pose this question at the beginning of the school year: What can we learn by collecting and analyzing daily outdoor temperatures?
Math Topic/Concept: collect, organize, and analyze, interpret & present data
Materials: outdoor thermometer, record book or chart, and
calculators
(optional supplies to have available: graph paper, paper supplies,
markers, crayons)
Classroom Use: (Developmental)
Classroom use comments*: Provide introductory discussion with students; record students responses; solicit predictions of temperatures and trends; generate a vocabulary list to use for the ongoing project. This is a daily, year-long project. Periodically, stats can be used to find median, mode, range, and rates of change. Numerous graphing activities are possible. (Also use this in conjunction with a probability activity, What Are Your Chances? Keep all students names in a can and draw one each day to see who will record the time and outdoor temperature. Ask each day for students to identify their chances of having their names drawn from the can.)
Grade: 4-5
Grade Cluster: (LateElem)
Illinois Goal: 10
Standard: 10.A.2a, 2b, & 2c; 10.B.2b, 2c & 2d; 10.C.2b (also 6.C.2a, 6.C.2b, and 6.D.2)
Applied? (1-4): 3
Source: Rebecca Cummins
Answer: various, depending on data collected. Check students accuracy in reading measurements, check their calculations and final products (such as graphs)
Strategies Listed: use measurement devices, use estimation and computation, make table, charts, and lists, look for patterns and trends, develop graphs, use calculators
Solution: Students make predictions (forecast the weather), then read and record daily time and outdoor temperature. They will periodically use the data to find median, mode, range, and rates of change. They can use the data to demonstrate results, trends and comparisons. Graphs can be created to compare and interpret data and to apply statistical information to make decisions in the real world.
Other solution methods (if any)*: Students may record daily readings in computer data base and manipulate according to specific tasks or needs
Extensions or related problems*: Students may choose and create a style of graphing to communicate results of interest to them. They may use classroom tools and manipulatives, or they may use a computer program to produce the graphs.
Intended rubric or assessment method: for the graphs or other student products, use the Analytic Scoring Scale (Jim Olsen, WIU)
Write-up submitted by: Rebecca Cummins (Westmer CUSD 203)
Problem: One summer Shane kept a record of how many kilometers
he rode on his
skateboard. He wont tell what the number is but he will give you
these clues:
· It is less than 100.
· It is more than 44.
· If you count by 4s, you say the numbers name.
· The number can be divided evenly by 5 and 8.
How many kilometers did Shane
go on his skateboard?
Math Topic/Concept: Greater than, Less than; number sense; patterning
Materials: Pencil, paper
Classroom Use: (Evaluation)
Grade: 4th grade
Grade Cluster: (LateElem)
Illinois Goal: 6, 10
Standard: 6A2, 10A.2c
Applied? (1-4): 4
Source: Problem solver 4 by Judy Goodnow and Shirley Hoogeboom,
- Creative
Publications ISBN 0-88488-584-4
Answer: 80 Kilometers
Strategies Listed: Make a table
Solution: I made a table starting with 44 and ending with
100. Then I counted by 4s
from 44 and put those numbers
on the chart. Then I looked at all the numbers
I had
on the chart and found the one that
could be divided by 5 and 8.
|
|
|
|
|
|
|
|
|
|
|
|
|
|
|
|
Intended rubric or assessment method: Student-Friendly ISAT rubric
Write-up submitted by: Donna Spears
James R. Olsen, Western Illinois University
E-mail: jr-olsen@wiu.edu
updated August 16, 2001